3 CLiVE: Climate Local Vulnerability and Exposure
3.1 Introduction
CLiVE (Climate Local Vulnerability and Exposure) aims to characterise environmental risk at local scales.
Climate change is reshaping the geography and intensity of environmental hazards around the world, including the UK. Rising temperatures are contributing to more frequent and intense heatwaves, changing rainfall patterns are increasing the likelihood and severity of localised flooding, and warming-induced atmospheric changes are exacerbating episodes of air pollution.
These climate-related hazards do not affect all places or populations equally. Their impacts are shaped by the distribution of people and infrastructure, and by social and economic inequalities that influence individuals’ capacity to prepare for, cope with, and recover from, adverse events.
However, our ability to systematically monitor these risks at the local scale, where impacts are experienced and decisions are made, remains limited. Many existing datasets are challenging to access due to their format or required level of technical skills. Friendly-to-access formats may fail to capture subnational variation, are not updated with sufficient frequency, or overlook key dimensions of risk such as population exposure and vulnerability.
As a result, local governments, public health agencies and researchers often lack the actionable data they need to identify priority areas, design targeted interventions and monitor progress over time.
3.2 Quantifying local vulnerability and exposure
CLiVE is a new data product designed to address this gap, providing a scientifically robust, spatially granular and policy relevant suite of indicators to quantify environmental risk across the UK. It is grounded in the Intergovernmental Panel on Climate Change (IPCC) conceptualisation (Klein et al. 2014), which defines risk as the interaction of three key components:
Hazards: climate-related physical processes or events that may cause harm, such as extreme heat, flooding, or elevated levels of air pollution.
Exposure: the presence of people, assets or systems in locations that could be adversely affected by those hazards.
Vulnerability: the propensity or predisposition of exposed individuals or communities to be negatively impacted, influenced by factors such as age, health status, income, or housing quality.
In its initial release, CLiVE focuses on developing indicators for the hazard component of risk. These indicators are derived from satellite imagery and Earth observation data, enabling consistent and scalable assessments across subnational areas of the UK. Specifically, the CLiVE toolkit includes heat stress, flood risk and carbon emissions.
3.3 Making satellite imagery data useful, usable and used
CLiVE is designed as an open, extensible platform delivering data in accessible and friendly-to-use formats. Future releases will incorporate indicators of population exposure, such as residential density, building typologies, or mobility patterns and social vulnerability, drawing on demographic, social, economic and infrastructure data.
The product will also expand its temporal resolution (e.g. seasonal or monthly indicators) and geographic scope (e.g. devolved administrations, national comparatives), enabling both longitudinal tracking and cross-regional comparison and analysis.
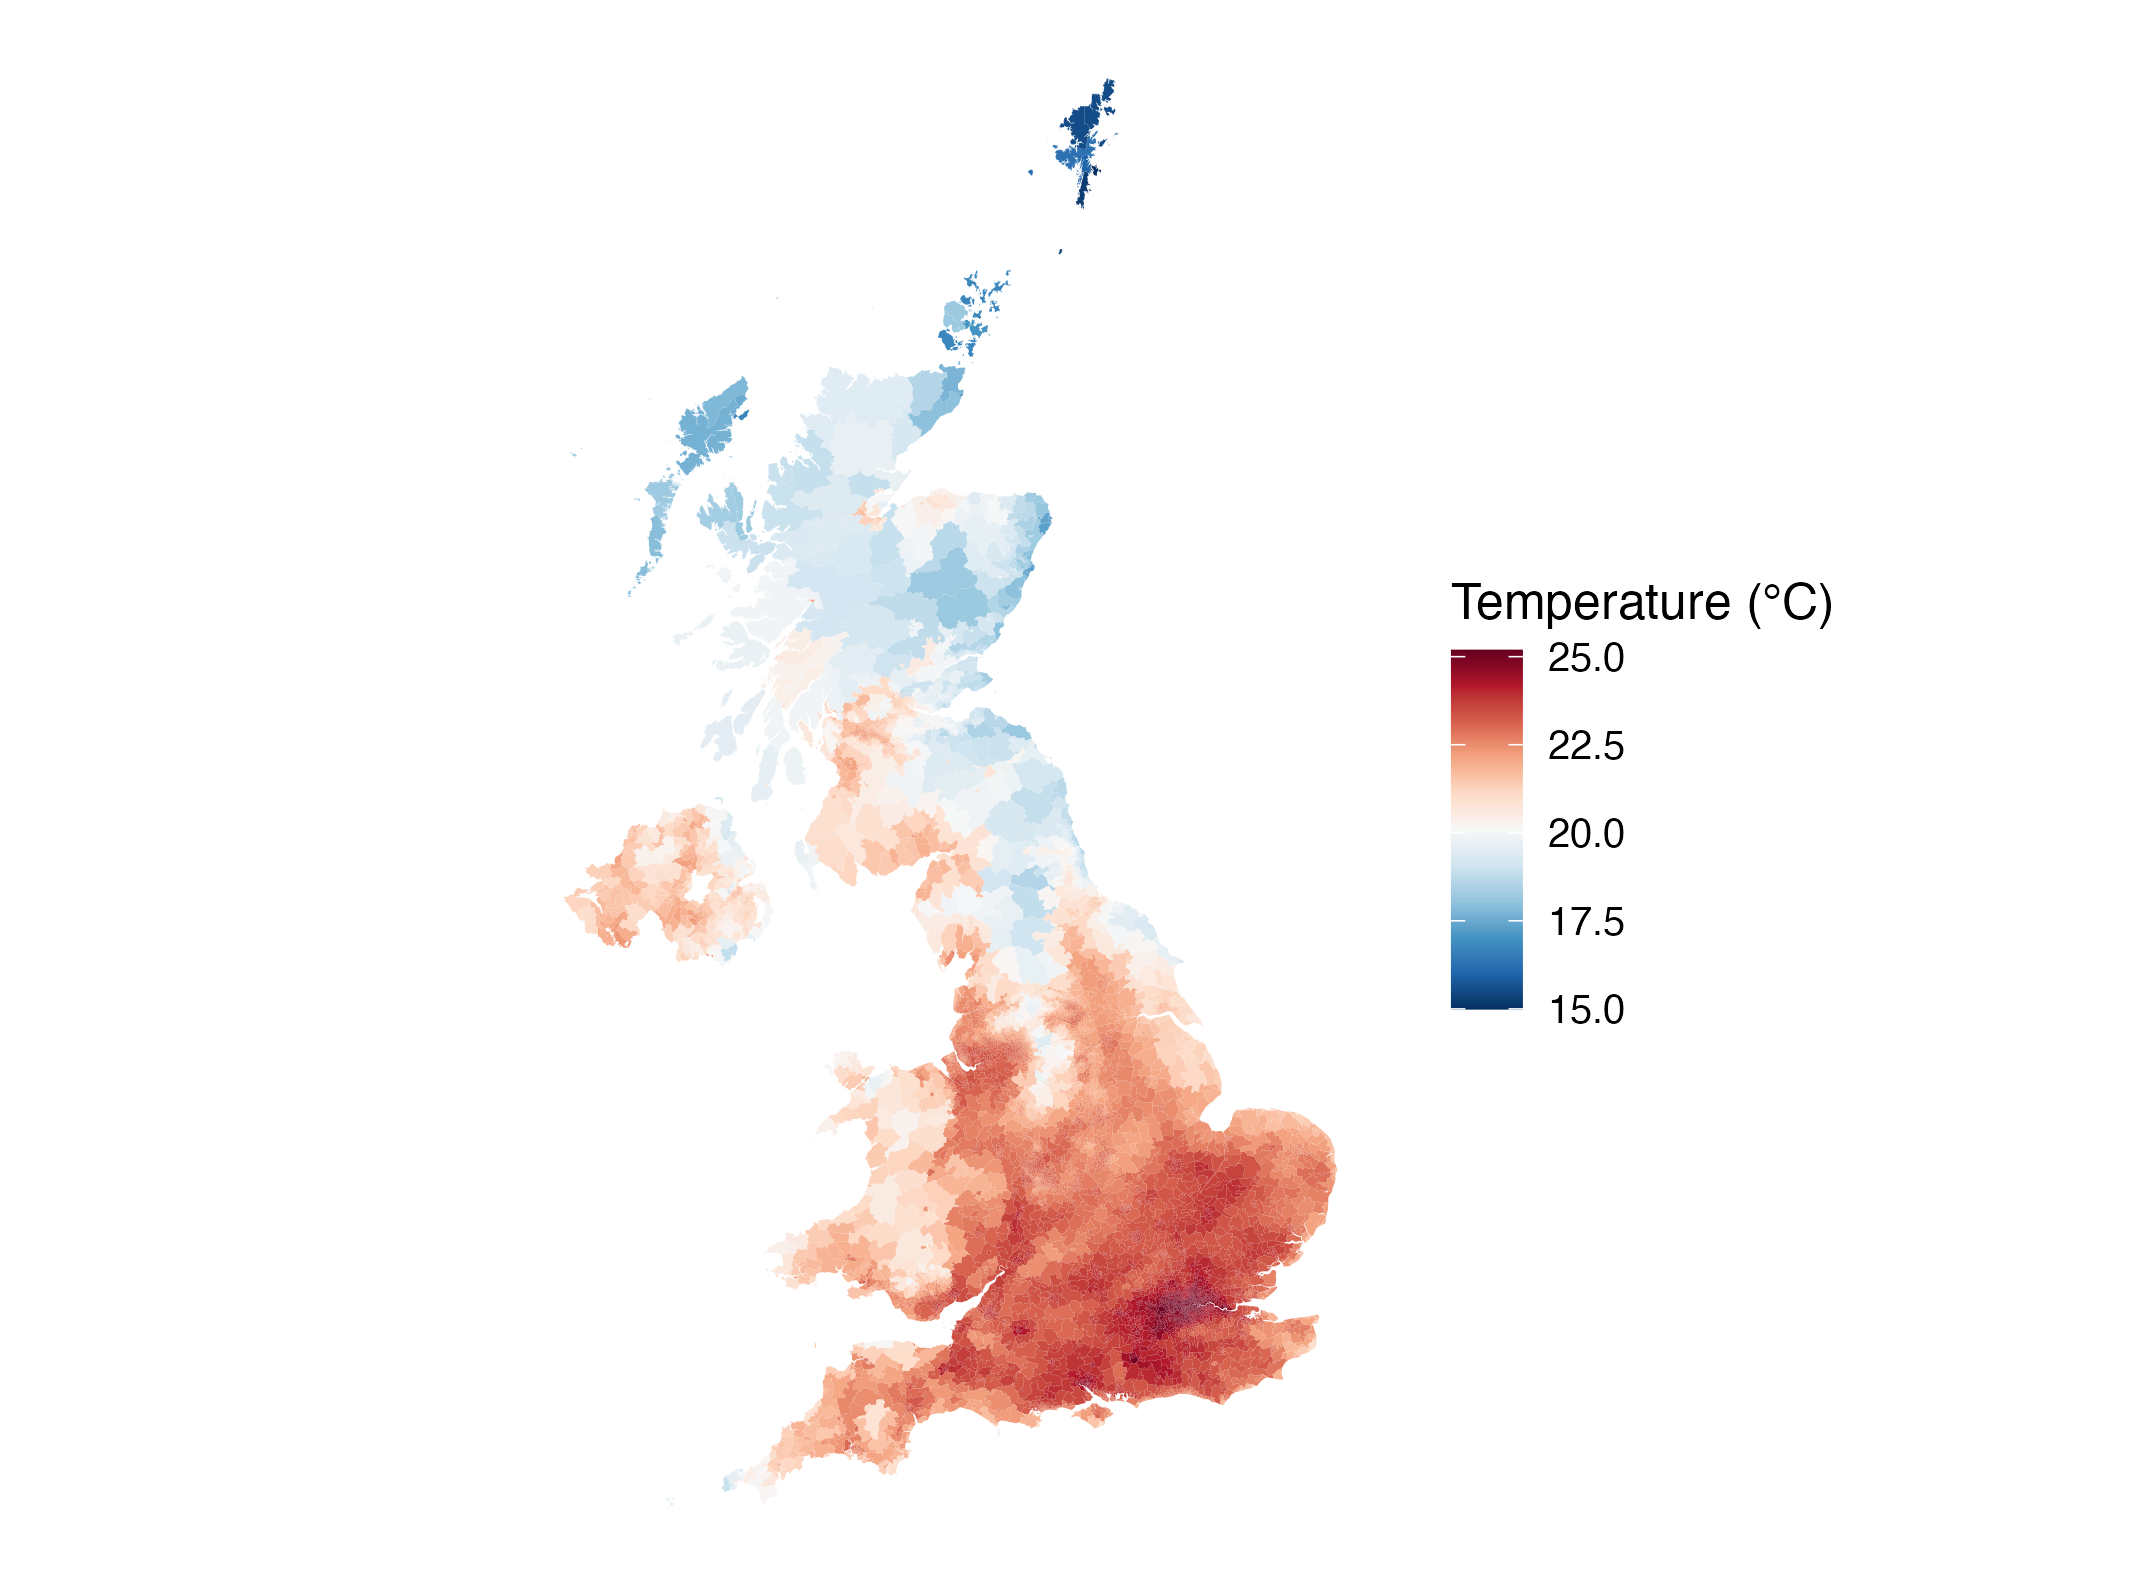
Figure 4.1 shows the summer maximum temperatures in 2023 across middle super output areas (MSOAs) in the UK. It highlights emerging spatial patterns of heat exposure. The indicator reflects the highest temperatures recorded during the UK Heat-Health Alert period—June to September—using monthly maximum temperature grids. Using 1 km HadUK-Grid data as the input, we aggregated pixel-level observations to the MSOA-equivalent scale using area-weighted means so that each estimate accurately represents the underlying land area. Temperatures ranged from 15°C to 25°C, showing a clear north–south divide: Scotland and northern England remained considerably cooler, while southern England, especially London, experienced the highest summer maxima. Other major cities, including Manchester and Bristol, also emerged as hotspots, underscoring the growing heat burden in densely populated urban areas.