2 Satellite imagery data
2.1 Introduction
Imagine opening a photograph on your computer and zooming in until the image breaks into tiny squares. Each square is a pixel, the basic building block of any digital image. Satellite imagery works in much the same way, but rather than capturing a single scene, satellites record information about the Earth’s surface at a global scale. Each pixel represents a measurement of energy reflected or emitted from the ground, forming a raster grid that can be used to observe patterns across entire regions. These measurements extend well beyond the visible light captured in everyday photographs. Satellite sensors collect different kinds of information, including how detailed the image is (i.e., spatial resolution), how often a location is revisited (i.e., temporal resolution), which wavelengths of light are measured (i.e., spectral resolution), and how precisely brightness differences can be detected (i.e., radiometric resolution). Together, these characteristics allow satellites to detect changes and features that are not easily observed from the ground. Further, unlike surveys conducted from aircraft such as small or medium-sized planes, helicopters, or Uncrewed Aerial Vehicles (UAVs), or through in situ fieldwork, satellite systems provide consistent, repeated coverage across large areas. This regularity and breadth of observation make them a powerful resource for studying social, environmental, and economic processes over time.
Since the launch of early spacecraft such as Sputnik 1 1 in 1957 and the first Landsat mission 2 in 1972, satellite remote sensing has transformed dramatically. Advances in sensor technology, data transmission, and storage have expanded both the quality and quantity of available imagery. What began as a set of missions operated by a few national space agencies has evolved into a diverse ecosystem that includes government programmes, commercial providers, public–private partnerships, and constellations of small satellites (Undseth, Jolly, and Olivari 2021). Today, hundreds of satellites collect imagery with levels of detail and frequency that were technologically impossible only a decade ago.
At the same time, developments in cloud computing and machine learning have reshaped how satellite data are accessed and analysed. Large archives that once required specialist infrastructure can now be explored through online platforms offering scalable processing and near-real-time updates. For researchers, this means unprecedented access to timely, consistent observations of the Earth’s surface.
This chapter introduces the main types of satellite imagery, how they are collected, and the steps involved in preparing them for analysis. It also explains the rapidly evolving landscape of data access, including cloud platforms and licensing models, and highlights key ethical considerations that shape the responsible use of Earth observation. Throughout, the chapter emphasises how satellite imagery can support social, environmental, and policy research, providing readers with the conceptual foundation needed to choose, interpret, and apply these data effectively.
2.2 Chapter objectives
This chapter provides an overview of how satellite imagery is produced, accessed, and used in research and applied settings. By the end of the chapter, readers will be able to:
- Understand core concepts and terminology related to satellite imagery, including key forms of resolution and what they reveal about the Earth’s surface.
- Situate satellite imagery within the wider geospatial and social science data ecosystems, recognising how it complements more familiar sources such as surveys and administrative records.
- Identify the main sensor types, satellite platforms, and missions, and assess their respective strengths, limitations, and relevance for different research questions.
- Explain how satellite imagery is accessed, including the role of open-access repositories, commercial providers, cloud platforms, APIs, and licensing models.
- Evaluate appropriate uses of satellite imagery for social, environmental, and policy applications, including how resolution choices, data characteristics, and ethical considerations shape what can be meaningfully observed.
2.3 Fundamentals of satellite imagery
2.3.1 Resolution dimensions
Understanding resolution is essential when working with satellite imagery, and the concept is already familiar to social scientists even if the terminology differs. In many areas of social research, choosing the correct scale of analysis is a fundamental step. Studies may draw on individual-level data, neighbourhood statistics, municipal indicators, or national aggregates, depending on the question being asked. These decisions reflect an underlying concern with the appropriate level of detail needed to capture the processes of interest. Satellite imagery follows the same logic. Resolution determines the scale at which features and changes on the Earth’s surface can be meaningfully observed. Selecting between fine, moderate, or coarse spatial detail mirrors the choice between analysing individuals, neighbourhoods, or cities. Temporal resolution parallels decisions about how frequently social or environmental processes must be measured, while spectral and radiometric resolution influence the types of distinctions that can be drawn within the data. In this sense, resolution is the satellite equivalent of selecting a unit of analysis: the choice that aligns the data with the processes under examination.
These four forms of resolution shape what satellite imagery can reveal and how it can support different kinds of research. Spatial resolution determines the level of visible detail, temporal resolution governs how often a place is revisited, spectral resolution enables the identification of surface materials and conditions, and radiometric resolution affects how precisely differences in brightness can be detected. Together, they influence whether imagery is appropriate for fine-grained local analysis, broad regional monitoring, or anything in betweeA summary of these differences is presented in Table 2.1.
| Resolution Type | Definition | Example Satellites / Sensors | Typical Applications |
|---|---|---|---|
| Spatial Resolution | Size of ground area represented by each pixel. | WorldView-3 (0.31 m), Sentinel-2 (10 m), MODIS (250–1000 m) | Urban planning, infrastructure monitoring, land cover classification |
| Temporal Resolution | Frequency with which a satellite revisits the same location. | PlanetScope (daily), Sentinel-2 (5 days with constellation), Landsat 8 (16 days) | Change detection, crop monitoring, disaster response |
| Spectral Resolution | Number and width of spectral bands captured. | Sentinel-2 (13 bands), Hyperion (220 bands) | Vegetation health, mineral mapping, environmental analysis |
| Radiometric Resolution | Sensor’s sensitivity to differences in reflectance or brightness. | Landsat 8 (12-bit), MODIS (12-bit) | Vegetation stress detection, water quality, surface temperature analysis |
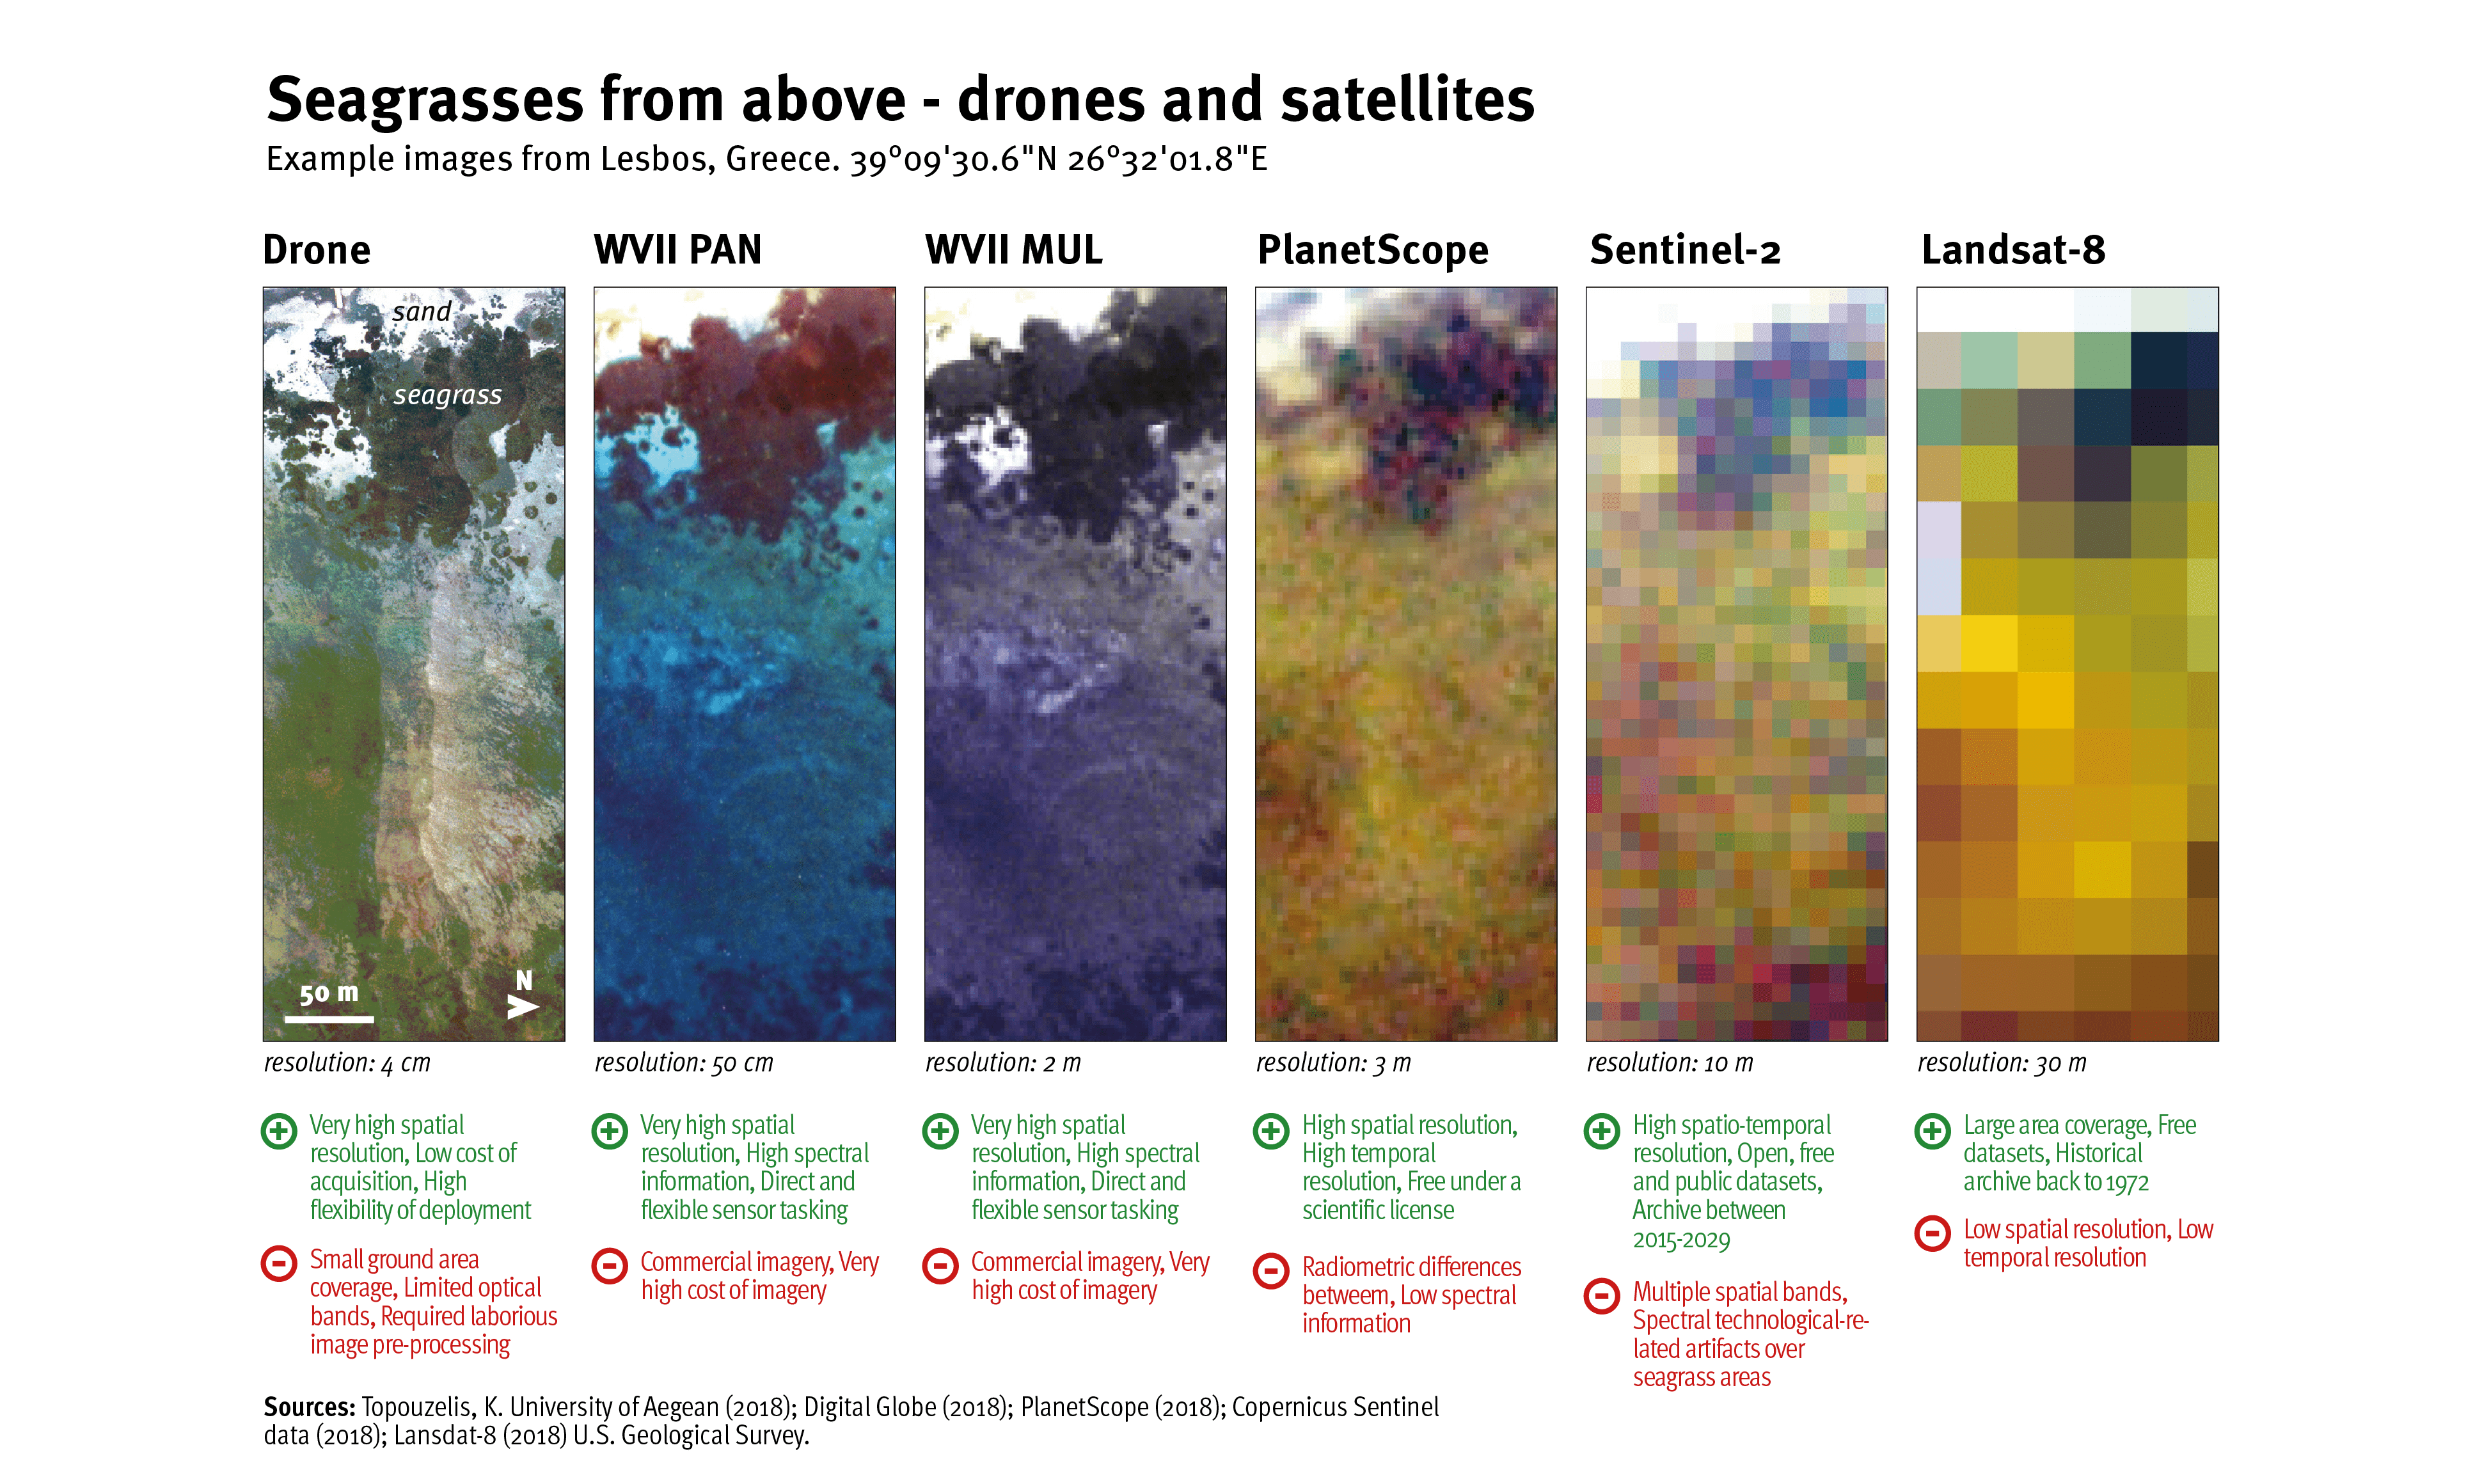
Spatial resolution refers to the size of the area represented by each pixel in a satellite image, and it plays a role very similar to choosing the geographic unit of analysis in social research. Many social questions depend on understanding variation at a particular scale, and spatial resolution determines whether such variation can be meaningfully observed. High-resolution imagery, such as that from WorldView-3 (n.d.a), functions much like highly disaggregated neighbourhood data, allowing researchers to identify features such as individual buildings, small settlements, and small-scale infrastructure that are often missing from administrative sources. Medium-resolution imagery is comparable to ward or district-level statistics, supporting analysis of settlement patterns, land-use change, or urban expansion across broader areas. Coarse imagery resembles regional or national aggregates and is suited to large-scale dynamics such as climate patterns or vegetation change. For social researchers, selecting an appropriate spatial resolution is therefore a familiar methodological decision: matching the level of spatial detail to the scale of the social or environmental processes under study (see example in Figure 2.1).
Temporal resolution describes how often a satellite revisits and captures imagery of the same location. For many social and environmental questions, this is similar to deciding how frequently observations need to be collected in a survey or administrative dataset. High temporal resolution is valuable when processes change quickly, such as crop growth, flooding, or wildfire spread, because it allows researchers to track events as they unfold. Platforms like PlanetScope can provide near-daily updates, making them suitable for situations where timing is critical. Other missions, including Landsat, revisit areas less frequently and are therefore better suited to long-term monitoring where the priority is consistency over many years rather than rapid change (Wulder et al. 2012).
Spectral resolution refers to the range of information a sensor collects about how surfaces reflect or emit light. A helpful way to think about it is to imagine having multiple “layers” of data for the same place, each revealing a different aspect of the landscape. Some sensors collect only a few broad layers, which are useful for distinguishing major land cover types, while others collect many narrower layers that allow more detailed discrimination. For example, the different bands in Sentinel-2 make it possible to identify healthy vegetation, bare soil, water bodies, and built surfaces, while hyperspectral systems provide even finer distinctions. For social scientists, this means that spectral information can help identify land-use patterns, detect environmental stress, and map resources that are not visible in standard photography.
Radiometric resolution captures how sensitive a sensor is to small differences in brightness. In practice, this determines how well subtle variations in the landscape can be detected. Higher radiometric precision helps reveal gradual changes in vegetation condition, small differences in water quality, or variations in surface temperature. This can be particularly important in studies where small shifts matter, such as detecting early signs of drought stress, monitoring urban heat, or assessing the environmental impacts of development. Rather than focusing on the technical details of bit-depth, the key idea is that higher radiometric resolution provides a clearer and more nuanced picture of change.
Although presented separately, these forms of resolution work together. Most applications require balancing spatial, temporal, spectral, and radiometric considerations so that the imagery chosen matches both the scale of the research question and the nature of the phenomenon being observed.
2.3.2 Sensor types
Satellite sensors measure different kinds of energy reflected or emitted from the Earth’s surface, and each type provides distinct information about social and environmental conditions. Although the underlying physics can be complex, the practical distinction is straightforward: different sensors reveal different aspects of the landscape, much like how social datasets provide different perspectives on population, infrastructure, or economic activity. Sensors vary mainly in the wavelengths they measure and in whether they rely on external illumination or generate their own signal (Jensen 2009).
Optical sensors record sunlight reflected from the surface in visible and near-infrared wavelengths, producing imagery that resembles photographs. However, they cannot see through clouds (Campbell and Wynne 2011). These sensors are widely used to map land cover, identify urban expansion, observe patterns of settlement density, and assess vegetation health, all of which are highly relevant for studies of urbanisation, land use, or environmental inequality. Radar sensors, including Synthetic Aperture Radar (SAR), operate in the microwave part of the spectrum and actively send out their own signal. Because they can collect data through cloud cover and at night, radar is particularly useful in regions with persistent cloudiness or during extreme events (Ferretti, Prati, and Rocca 2002). For social researchers, SAR is especially valuable for mapping floods, monitoring infrastructure stability, or detecting changes that may signal informal settlement growth or land subsidence.
Thermal sensors measure heat emitted from the surface, making it possible to identify warm and cool areas. These data are useful for understanding urban heat islands, detecting wildfires, assessing energy efficiency in built environments, or examining temperature extremes that may affect vulnerable populations. Whereas hyperspectral sensors collect information across hundreds of narrow wavelengths, allowing for very detailed discrimination of materials (Richards, Richards, et al. 2022; Goetz 2009). While more specialised, these sensors can reveal subtle differences in vegetation stress, soil composition, water quality, or pollution, providing valuable evidence for environmental justice research, agricultural monitoring, or natural resource management.
A summary of these sensor types is provided in Table 2.2. Each type offers different strengths and limitations, and together they provide a suite of complementary tools that support decision making in areas such as disaster response, climate monitoring, land management, and urban planning.
| Attribute | Optical (e.g. Landsat 8 OLI) | Radar (e.g. Sentinel-1 SAR) | Thermal (e.g. MODIS, ECOSTRESS) | Hyperspectral (e.g. EO-1 Hyperion) |
|---|---|---|---|---|
| Energy Source | Passive | Active | Passive | Passive |
| Wavelength Range | Visible and near-infrared | Microwave | Thermal infrared | Hundreds of narrow spectral bands |
| Key Capabilities | Captures sunlight reflected from the Earth’s surface to produce imagery comparable to photographs. | Transmits microwave pulses and measures the reflected signal to detect surface features and movement. | Measures heat naturally emitted from the Earth’s surface, providing information on temperature variations. | Records continuous spectral data across numerous narrow bands, enabling identification of surface materials. |
| Common Applications | Land cover classification, vegetation health monitoring, urban growth analysis. | Flood mapping, ground deformation studies, forest structure analysis. | Wildfire detection, urban heat island assessment, thermal efficiency studies. | Precision agriculture, mineral mapping, environmental quality assessments. |
| Strengths | High spatial resolution and easily interpretable images. | Weather- and light-independent, consistent data acquisition. | Effective for identifying temperature anomalies and thermal patterns. | Fine-grained detection of subtle spectral differences among materials. |
| Limitations | Affected by cloud cover and requires daylight. | Complex to interpret, needs specialised processing. | Lower spatial resolution and less visual detail than optical sensors. | Large data volumes, sensitive to atmospheric conditions. |
2.3.3 Key satellite platforms and missions
Satellite imagery is produced by a wide range of organisations, from long-established national space agencies to commercial companies launching constellations of small satellites. Understanding this landscape helps social researchers identify which systems align with their questions, whether they concern long-term environmental change, rapid-onset crises, or fine-grained patterns of urban development. The field has expanded rapidly, and the combination of public and commercial missions now underpins applications across development, governance, planning, climate adaptation, and humanitarian response.
Government-funded missions form the backbone of global Earth observation, providing free, standardised, and long-term datasets essential for research and public policy. One of the most influential is the Landsat programme, which has operated continuously since 1972 (n.d.b). Its archive offers an unparalleled record of landscape change, supporting analyses of deforestation, urban expansion, agricultural dynamics, and coastal transformation over nearly five decades (Wulder et al. 2019). Building on this foundation, the European Union’s Copernicus Sentinel missions provide more frequent coverage and a broader range of sensing capabilities. Sentinel-1 supplies Synthetic Aperture Radar (SAR) data that can image the Earth regardless of cloud cover or daylight (Drusch et al. 2012; n.d.c), Sentinel-2 delivers multispectral optical imagery widely used for vegetation and urban monitoring, Sentinel-3 provides land and sea surface temperature and ocean topography, and Sentinel-4, Sentinel-5, and Sentinel-6 contribute atmospheric and sea-level measurements (n.d.d).
Earth observation capacity now extends well beyond Europe and the United States. China’s Gaofen series provides optical and radar data suitable for land management and infrastructure monitoring. Japan’s ALOS missions contribute high-quality radar and multispectral imagery valuable for disaster response and forest mapping. Brazil’s CBERS programme, jointly operated with China, supplies medium-resolution imagery widely used across South America for agriculture, deforestation tracking, and environmental planning. These missions reflect the growing global diversification of Earth observation capabilities.
Before the emergence of new commercial players, the commercial landscape was dominated by “old space” companies such as Airbus and Maxar Technologies. These firms operate large, high-performance satellites designed for maximum spatial resolution. Maxar’s systems, for example, produce sub-metre imagery capable of resolving individual buildings, vehicles, and other fine-scale features. Such imagery supports disaster response, infrastructure assessment, security analysis, and detailed urban studies. These companies remain central to applications requiring the highest spatial detail and controlled acquisition conditions.
A newer generation of “new space” companies has since disrupted this model, relying on smaller, cheaper platforms, large constellations, and faster revisit rates. Many of these firms employ traditional sensor types on smaller satellites. For example, Planet operates a constellation of small optical satellites offering near-daily global coverage at approximately 3.7 m resolution (Curzi, Modenini, and Tortora 2020; n.d.e), while companies like Umbra deploy small SAR satellites capable of high-quality radar imaging. These systems trade extremely fine spatial detail for rapid temporal coverage, enabling the monitoring of changing phenomena such as crop cycles, flooding, wildfire progression, or informal settlement growth.
Other new space actors focus on novel sensing capabilities rather than scaling traditional ones. SatVu is developing high-resolution thermal satellites designed to capture heat signatures at unprecedented spatial detail, supporting applications ranging from energy efficiency to environmental monitoring. Several emerging providers are launching next-generation hyperspectral systems capable of analysing hundreds of spectral bands, allowing fine discrimination of surface materials relevant for agriculture, environmental health, pollution tracking, and natural resource management.
Together, public missions, old-space operators, and new-space companies offer complementary strengths: long-term continuity, high spatial detail, frequent revisit rates, and an increasingly diverse range of sensing technologies. This combination supports more flexible and robust analysis across disciplines. Live orbital positions of many satellites can be viewed on platforms such as satellitemap.space.
2.4 Data acquisition and accessibility
Satellite imagery is now available through an expanding ecosystem of public repositories, commercial providers, and cloud-based platforms. For many social researchers, this landscape can feel unfamiliar because it differs markedly from the traditional model of acquiring data as pre-packaged tables or survey files. The goal of this section is to introduce the main pathways through which satellite imagery can be accessed, explain how these systems have evolved, and highlight what they mean for researchers who may be new to Earth observation data. The section also outlines practical considerations such as licensing, cost, and ethical use.
2.4.1 Sources of satellite imagery
Satellite imagery is available through a combination of open-access government missions and commercial providers, each offering different levels of detail, frequency, and accessibility. For many social researchers, this structure differs from the more familiar landscape of statistical agencies and survey organisations, making it useful to understand the main pathways through which imagery can be obtained.
Open-access government missions such as the United States Geological Survey (USGS) Landsat programme and the European Space Agency’s (ESA) Sentinel satellites, part of the Copernicus programme, have played a central role in democratising Earth observation data. These missions provide free, standardised, and globally consistent imagery that supports long-term environmental monitoring, disaster response, land-use classification, and climate change research (Wulder et al. 2012; Drusch et al. 2012). The Landsat archive is particularly important for social and environmental research because it offers the longest continuous record of the Earth’s surface from space, beginning in 1972 (Wulder et al. 2019; Roy et al. 2014). This half-century of consistent imagery enables robust analyses of trends such as urban expansion, agricultural change, deforestation, and coastal development.
Commercial providers such as Maxar Technologies and Planet Labs supply imagery with much finer spatial resolution and, in some cases, more frequent updates. These data can capture features as small as 30 centimetres, making them well suited for applications requiring detailed views of buildings, transport networks, public spaces, or infrastructure (Belward and Skøien 2015). Such detail is valuable for studies of environmental inequalities, micro-scale land use, and emergency response. However, access to this level of resolution is typically restricted by licensing fees and usage limitations, which may inhibit use by academic researchers or humanitarian organisations depending on budget, institutional agreements, and intended use.
To bridge the gap between public missions and high-resolution commercial data, hybrid access models are becoming more common. Programmes such as NASA’s Commercial Smallsat Data Acquisition (CSDA) initiative (n.d.f) and ESA’s Third Party Missions scheme (n.d.g) enable researchers and non-profit organisations to access selected commercial imagery at reduced or subsidised cost. These models expand opportunities for scientific research and public-good applications while acknowledging that high-resolution data remain commercially valuable assets.
2.4.2 Access to satellite data
Access to satellite imagery has evolved significantly over time, and understanding this evolution helps social researchers navigate a landscape that may feel unfamiliar compared with traditional datasets. Historically, Earth observation data were acquired through government portals where users manually downloaded large image files to local computers. This approach required substantial storage, technical expertise, and computing capacity, and differs sharply from the experience of working with survey microdata or administrative tables that can be opened in standard statistical software.
More recently, cloud-based platforms and application programming interfaces (APIs) have transformed how satellite data are accessed and analysed. Cloud platforms store large archives of imagery and allow users to process data remotely, reducing the need for powerful personal hardware. APIs provide programmatic access to these systems, enabling automated searches, downloads, and analysis workflows.
One of the most widely used platforms is Google Earth Engine (GEE), which hosts extensive archives of imagery from missions such as Landsat, Sentinel, and MODIS, combined with large-scale cloud computing (Gorelick et al. 2017). Through its JavaScript and Python APIs, users can conduct analyses ranging from land cover classification to deforestation monitoring and climate trend assessment without handling raw files locally. This model significantly lowers entry barriers for researchers, practitioners, and students who may not have access to high-performance computing (Zhao et al. 2021; Mutanga and Kumar 2019; Cardille et al. 2024).
Other platforms such as the Copernicus Open Access Hub (n.d.h) and USGS EarthExplorer (Survey, n.d.) provide direct downloads of Sentinel and Landsat imagery. These interfaces support browsing, previewing, and bulk downloads, offering transparency and flexibility, though they still require users to manage large files. Commercial providers including Planet and Maxar also offer APIs that support searching, filtering, and requesting imagery programmatically, including on-demand tasking of satellites to capture new images at additional cost. These tools integrate readily with machine learning models, automated monitoring pipelines, and real-time decision-support systems.
As datasets have increased in size and complexity, new cloud-native standards have become central to modern Earth observation. Cloud Optimised GeoTIFFs (COGs) allow users to load specific portions of an image without downloading entire scenes (n.d.i), improving efficiency and enabling scalable analysis. The SpatioTemporal Asset Catalog (STAC) standard streamlines metadata across providers, making it easier to locate and combine imagery. Major platforms such as Amazon Web Services (AWS), Google Earth Engine, and Microsoft’s Planetary Computer host these optimised datasets, supporting large-scale analysis without the need for local infrastructure.
For many social researchers, this model of accessing satellite imagery contrasts sharply with the way social science datasets are typically distributed. Survey microdata, census statistics, and administrative records are usually accessed as relatively small tabular files that can be downloaded and analysed on a single laptop. Satellite imagery, by contrast, consists of multi-dimensional raster files that may span millions of pixels, multiple spectral bands, and long-time series. These differences explain why workflows for Earth observation increasingly rely on cloud platforms, APIs, and optimised formats: the scale and structure of satellite data make traditional download-and-store approaches impractical. Recognising these distinctions helps social scientists understand why satellite data require different tools, infrastructures, and ways of working.
Despite these advances, challenges remain. Storage and compute costs can limit access for sustained or large-scale projects. Metadata inconsistencies across missions and providers can make it difficult to combine datasets. Access to high-bandwidth internet and cloud computing resources is uneven globally, presenting barriers for researchers in low-resource settings (Lowndes et al. 2017). For social scientists, these issues can make satellite imagery appear more complex than traditional datasets, even though the insights it provides can be highly valuable for understanding spatial and environmental processes.
2.4.3 Licensing and cost
Licensing models vary considerably and determine how satellite imagery can be used, shared, or modified. A licence is a legal agreement that outlines what users are permitted to do with a dataset. Open-access missions such as Landsat and Sentinel typically provide imagery under licences that allow free download, reuse, and redistribution (Wulder et al. 2012; Harris and Baumann 2015). These licences support transparency, reproducibility, and collaboration, mirroring the norms that social scientists may recognise from openly accessible survey datasets or administrative statistics.
Commercial satellite imagery operates under a very different model. Access is often restricted by licences that prohibit redistribution, impose usage limits, or require significant payment (Kim 2024). These conditions resemble proprietary datasets in the social sciences, such as consumer transaction data, mobile phone records, or commercial market intelligence, where access is controlled, costly, and shaped by contractual terms. For researchers accustomed to freely available census or survey data, the constraints attached to high-resolution imagery can affect project feasibility, reproducibility, and collaboration, and may require careful planning around budgeting and compliance.
2.4.4 Ethics
There are growing ethical concerns surrounding the use of satellite imagery. High-resolution images can capture detailed views of human activities and built environments, raising privacy issues when used in sensitive contexts such as humanitarian crises, armed conflict, or surveillance operations (Guida 2021; Avtar et al. 2021). These concerns echo long-standing debates in the social sciences about the potential harms associated with observing or documenting communities without their knowledge or consent. However, satellite imagery introduces additional complexity because individuals cannot opt out of being imaged, and data collection is conducted remotely, often by organisations far removed from the places being observed.
A related debate centres on data colonialism, where control over valuable datasets, including commercial high-resolution imagery, is concentrated among institutions in wealthier countries (Thatcher, O’Sullivan, and Mahmoudi 2016). This dynamic parallels critiques within the social sciences about unequal access to administrative data, proprietary geodemographic datasets, or corporate digital traces. Limited access to satellite data can constrain the ability of researchers, civil society organisations, and governments in lower-income regions to monitor land use, environmental change, or public infrastructure, potentially reinforcing global asymmetries in knowledge production and policy-making capacity.
These concerns also connect to broader ethical principles familiar to social researchers, such as fairness, accountability, and the avoidance of harm. Satellite imagery can be used to expose human rights abuses, monitor environmental degradation, or support disaster response, but it can also enable intrusive monitoring, militarised applications, or discriminatory practices if misused. As with social data, the context in which imagery is applied matters greatly. Responsible use requires reflecting on who benefits, who is put at risk, and whose voices are included or excluded in data-driven decision making. Encouraging ethical frameworks tailored to Earth observation helps ensure that satellite technologies support equitable and socially responsible outcomes.
2.5 Summary
Satellite imagery provides a unique vantage point for observing social, environmental, and economic processes, offering consistent and repeated coverage that is difficult to achieve through ground-based or survey methods. This chapter introduced the foundations of satellite imagery, explained the different forms of resolution that influence what can be observed, and outlined the main sensor types and satellite missions that support modern Earth observation. It also described how imagery is acquired, accessed, and prepared for analysis, highlighting the growing role of cloud platforms, APIs, and cloud-native data standards in making large datasets more usable. For social researchers, satellite imagery expands the range of questions that can be addressed, supporting analyses of urban development, environmental change, infrastructure, inequality, and dynamic processes that unfold too quickly or in too remote locations to be captured through traditional data sources.
At the same time, the chapter emphasised that the use of satellite imagery raises important practical and ethical considerations. Licensing models determine who can access high-resolution data and under what conditions, while unequal access to cloud computing and persistent metadata inconsistencies pose challenges for many research contexts. Ethical debates around privacy, surveillance, and data colonialism also mirror broader concerns within the social sciences about equity and the distribution of data access and power. When approached thoughtfully, satellite imagery offers a powerful and increasingly accessible resource that can support more informed decision making and contribute to efforts aimed at building more sustainable, resilient, and equitable futures.
Sputnik 1:
https://en.wikipedia.org/wiki/Sputnik_1↩︎Landsat 1:
https://en.wikipedia.org/wiki/Landsat_1↩︎